> ## Documentation Index
> Fetch the complete documentation index at: https://runpod-b18f5ded-lg-endpointlogs-453.mintlify.site/llms.txt
> Use this file to discover all available pages before exploring further.
# Monitor logs
> View and access logs for Serverless endpoints and workers. Review setup, configuration, deployment, and operations guidance for Runpod Serverless.
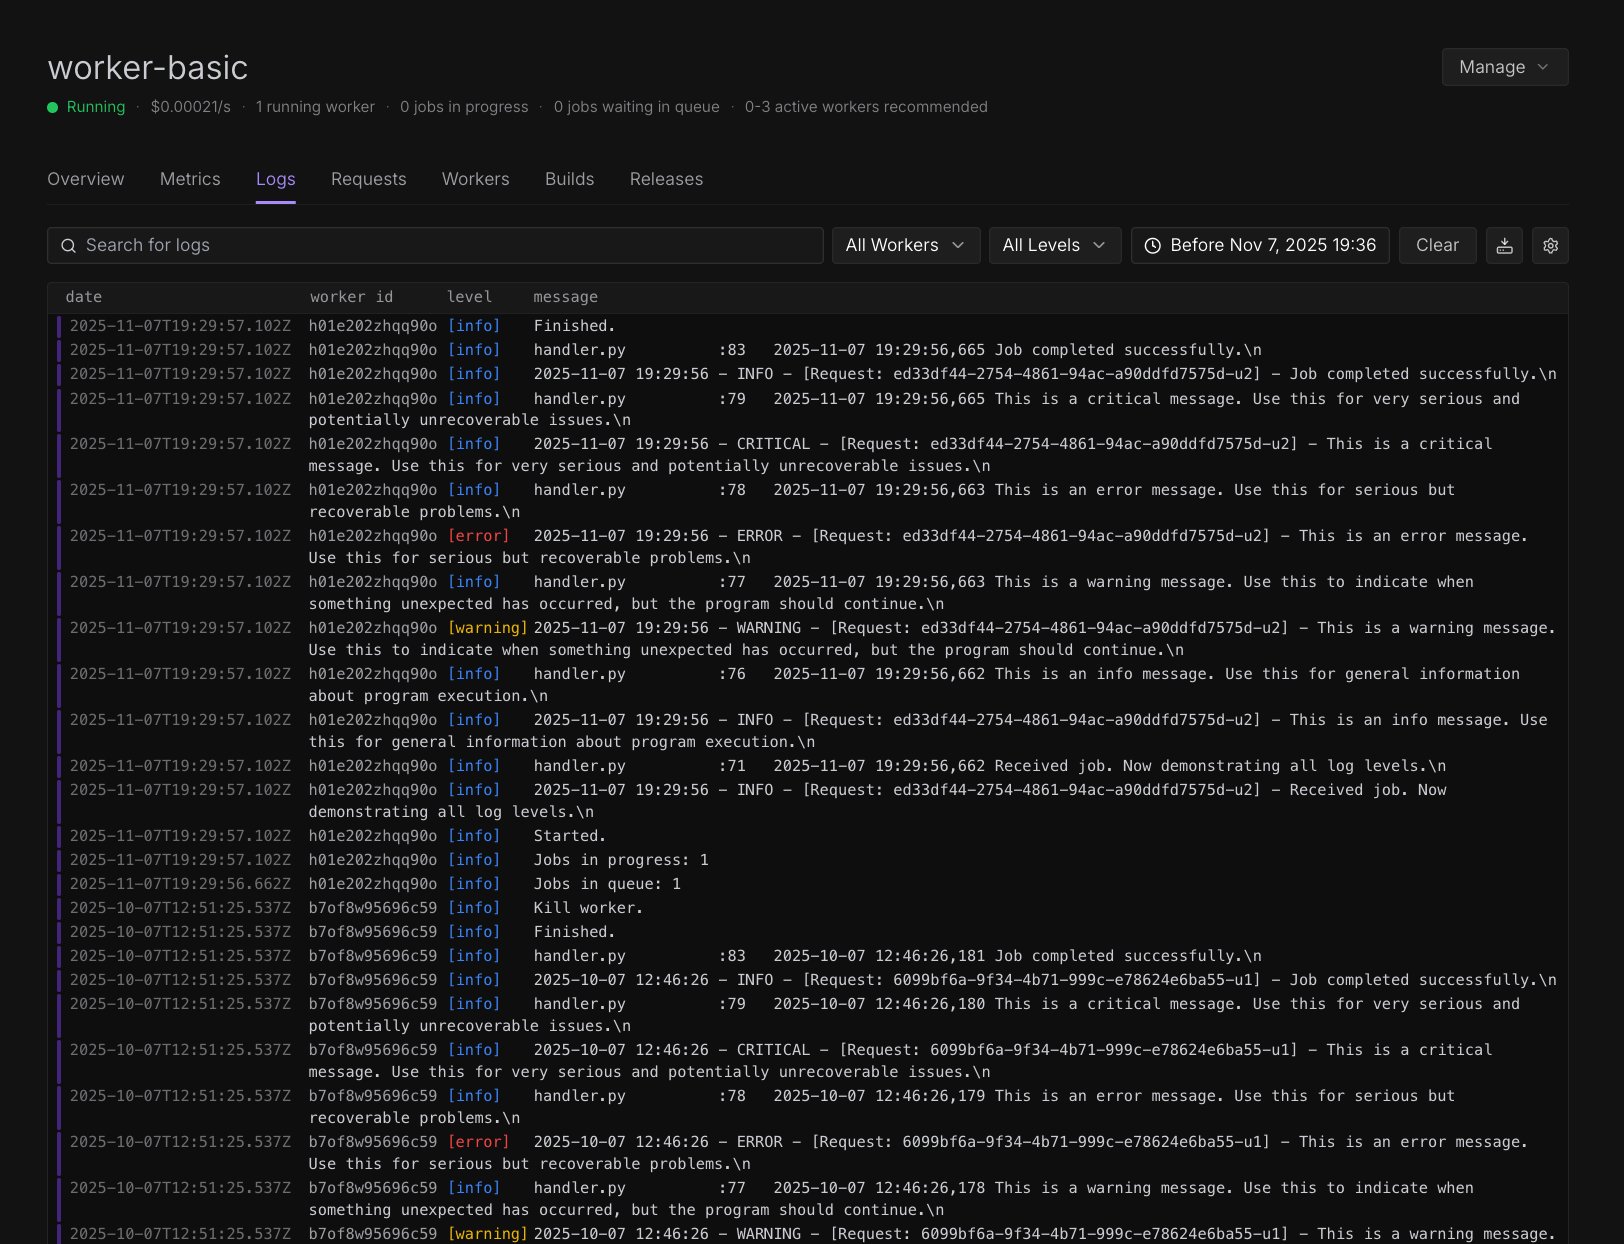 Runpod provides comprehensive logging capabilities for Serverless endpoints and workers. You can view real-time and historical logs through the Runpod console to help you monitor, debug, and troubleshoot your applications.
To learn how to write structured logs from your handler functions, see [Write logs](/serverless/development/write-logs).
## Endpoint logs
Endpoint logs are retained for 90 days, after which they are automatically removed from the system. If you need to retain logs indefinitely, you can [write them to a network volume](#persistent-log-storage) or an external service.
Endpoint logs are automatically collected from your worker instances and streamed to Runpod's centralized logging system. These logs include:
* **Standard output (stdout)** from your handler functions.
* **Standard error (stderr)** from your applications.
* **System messages** related to worker lifecycle events.
* **Framework logs** from the Runpod SDK.
To view endpoint logs, navigate to your Serverless endpoint in the [Runpod console](https://console.runpod.io/serverless) and click the **Logs** tab.
If your worker generates excessive output, logs may be throttled and dropped to prevent system overload. See [Log throttling](#log-throttling) for more information.
### Real-time streaming
The Logs tab streams new log entries automatically — no manual page refresh needed. Logs appear within a few seconds of being emitted by the worker.
{ /* [CONFIRM: Is there a "Live" / "Pause" toggle in the UI? If so, document it here with the exact label.] */ }
To scroll back through historical logs without the view jumping to new entries, scroll up in the log viewer. The stream continues in the background and new entries accumulate at the bottom.
### Request filtering
To view logs for a specific job, use the request filter:
1. Click the **Filter** field at the top of the Logs tab.
2. Enter the job ID you want to inspect.
3. The log view updates to show only entries associated with that request.
{ /* [CONFIRM: Is the filter field labeled "Filter", "Request ID", "Job ID", or something else? What does a user enter — the job ID from /run response, the worker ID, or something else?] */ }
Filtering by request is useful when debugging a specific failed job in a high-traffic endpoint where logs from many requests are interleaved.
To clear the filter and return to the full log stream, remove the value from the filter field.
### View in context
**View in context** lets you jump to the surrounding log lines for a specific entry. This is useful for seeing what happened immediately before and after an event of interest, such as an error or an unexpected output.
To use View in context:
1. Find the log entry you want to investigate.
2. Click **View in context** next to the entry.
3. The log view scrolls to and highlights that entry with the surrounding lines visible.
{ /* [CONFIRM: Is the button labeled exactly "View in context"? Is it a button, a link, or a hover action? Does it appear on every log line or only on certain entry types?] */ }
## Worker logs
Worker logs are temporary logs that exist only on the specific server where the worker is running. These logs are not throttled, but are not persistent, and are removed when a worker terminates.
To view worker logs:
1. Navigate to your Serverless endpoint in the [Runpod console](https://console.runpod.io/serverless).
2. Click on the **Workers** tab.
3. Click on a worker to view its logs and request history.
4. Use the search and filtering capabilities to find specific log entries.
5. Download logs as text files for offline analysis.
## Stream output to clients
To send progress updates or stream results to clients during job execution, see [Progress updates](/serverless/workers/handler-functions#progress-updates) and [Streaming handlers](/serverless/workers/handler-functions#streaming-handlers).
## Troubleshooting
### Missing logs
If logs are not appearing in the Logs tab:
1. **Check log throttling**: Excessive logging may trigger throttling.
2. **Verify output streams**: Ensure you're writing to stdout/stderr.
3. **Check worker status**: Logs only appear for successfully initialized workers.
4. **Review retention period**: Logs older than 90 days are automatically removed.
### Log throttling
To avoid log throttling, follow these best practices:
1. **Reduce log verbosity** in production environments.
2. **Use structured logging** to make logs more efficient.
3. **Implement log sampling** for high-frequency events.
4. **Store detailed logs** in network volumes instead of console output.
Runpod provides comprehensive logging capabilities for Serverless endpoints and workers. You can view real-time and historical logs through the Runpod console to help you monitor, debug, and troubleshoot your applications.
To learn how to write structured logs from your handler functions, see [Write logs](/serverless/development/write-logs).
## Endpoint logs
Endpoint logs are retained for 90 days, after which they are automatically removed from the system. If you need to retain logs indefinitely, you can [write them to a network volume](#persistent-log-storage) or an external service.
Endpoint logs are automatically collected from your worker instances and streamed to Runpod's centralized logging system. These logs include:
* **Standard output (stdout)** from your handler functions.
* **Standard error (stderr)** from your applications.
* **System messages** related to worker lifecycle events.
* **Framework logs** from the Runpod SDK.
To view endpoint logs, navigate to your Serverless endpoint in the [Runpod console](https://console.runpod.io/serverless) and click the **Logs** tab.
If your worker generates excessive output, logs may be throttled and dropped to prevent system overload. See [Log throttling](#log-throttling) for more information.
### Real-time streaming
The Logs tab streams new log entries automatically — no manual page refresh needed. Logs appear within a few seconds of being emitted by the worker.
{ /* [CONFIRM: Is there a "Live" / "Pause" toggle in the UI? If so, document it here with the exact label.] */ }
To scroll back through historical logs without the view jumping to new entries, scroll up in the log viewer. The stream continues in the background and new entries accumulate at the bottom.
### Request filtering
To view logs for a specific job, use the request filter:
1. Click the **Filter** field at the top of the Logs tab.
2. Enter the job ID you want to inspect.
3. The log view updates to show only entries associated with that request.
{ /* [CONFIRM: Is the filter field labeled "Filter", "Request ID", "Job ID", or something else? What does a user enter — the job ID from /run response, the worker ID, or something else?] */ }
Filtering by request is useful when debugging a specific failed job in a high-traffic endpoint where logs from many requests are interleaved.
To clear the filter and return to the full log stream, remove the value from the filter field.
### View in context
**View in context** lets you jump to the surrounding log lines for a specific entry. This is useful for seeing what happened immediately before and after an event of interest, such as an error or an unexpected output.
To use View in context:
1. Find the log entry you want to investigate.
2. Click **View in context** next to the entry.
3. The log view scrolls to and highlights that entry with the surrounding lines visible.
{ /* [CONFIRM: Is the button labeled exactly "View in context"? Is it a button, a link, or a hover action? Does it appear on every log line or only on certain entry types?] */ }
## Worker logs
Worker logs are temporary logs that exist only on the specific server where the worker is running. These logs are not throttled, but are not persistent, and are removed when a worker terminates.
To view worker logs:
1. Navigate to your Serverless endpoint in the [Runpod console](https://console.runpod.io/serverless).
2. Click on the **Workers** tab.
3. Click on a worker to view its logs and request history.
4. Use the search and filtering capabilities to find specific log entries.
5. Download logs as text files for offline analysis.
## Stream output to clients
To send progress updates or stream results to clients during job execution, see [Progress updates](/serverless/workers/handler-functions#progress-updates) and [Streaming handlers](/serverless/workers/handler-functions#streaming-handlers).
## Troubleshooting
### Missing logs
If logs are not appearing in the Logs tab:
1. **Check log throttling**: Excessive logging may trigger throttling.
2. **Verify output streams**: Ensure you're writing to stdout/stderr.
3. **Check worker status**: Logs only appear for successfully initialized workers.
4. **Review retention period**: Logs older than 90 days are automatically removed.
### Log throttling
To avoid log throttling, follow these best practices:
1. **Reduce log verbosity** in production environments.
2. **Use structured logging** to make logs more efficient.
3. **Implement log sampling** for high-frequency events.
4. **Store detailed logs** in network volumes instead of console output.